Three Shapes of the N+1 Problem in Django
A code review pointed at one Django function and exposed three different N+1 patterns. Here's how I fixed them and what the debug toolbar showed before and after.
TLDR: A reviewer flagged a Django function in my project as having an N+1 problem. It turned out there were actually three different N+1s hiding in there: one on every page load, two on the cache-miss path. Fixing them dropped the cache-hit query count from 16 to 7, and the cache-miss count from 25 to 11. The fixes ended up being
select_related,__in+ dict lookup, andbulk_create. Different tools for the same underlying problem.
The problem
The project I am building (a movie, anime, and manga discovery app I wrote about in my last post) lets users see where they can stream a given title, when services are available. The data comes from TMDB, and to avoid hammering their API on every page load I cache it locally in a StreamingOffer table with a TTL.
The function that does this lives in media/services.py and is called get_offers_for_movie. On a cache hit it returns the stored rows. On a cache miss it fetches fresh data from TMDB, replaces the cached rows, and returns the new ones.
It worked. It was even fast enough, on my laptop with a small database. But during a code review I got a comment that started, more or less, with: "this is an N+1." The reviewer suggested I install Django Debug Toolbar and see for myself.
I did. The page that felt fine was firing 16 queries. The cache-miss path was firing 25. Most of them were unnecessary.
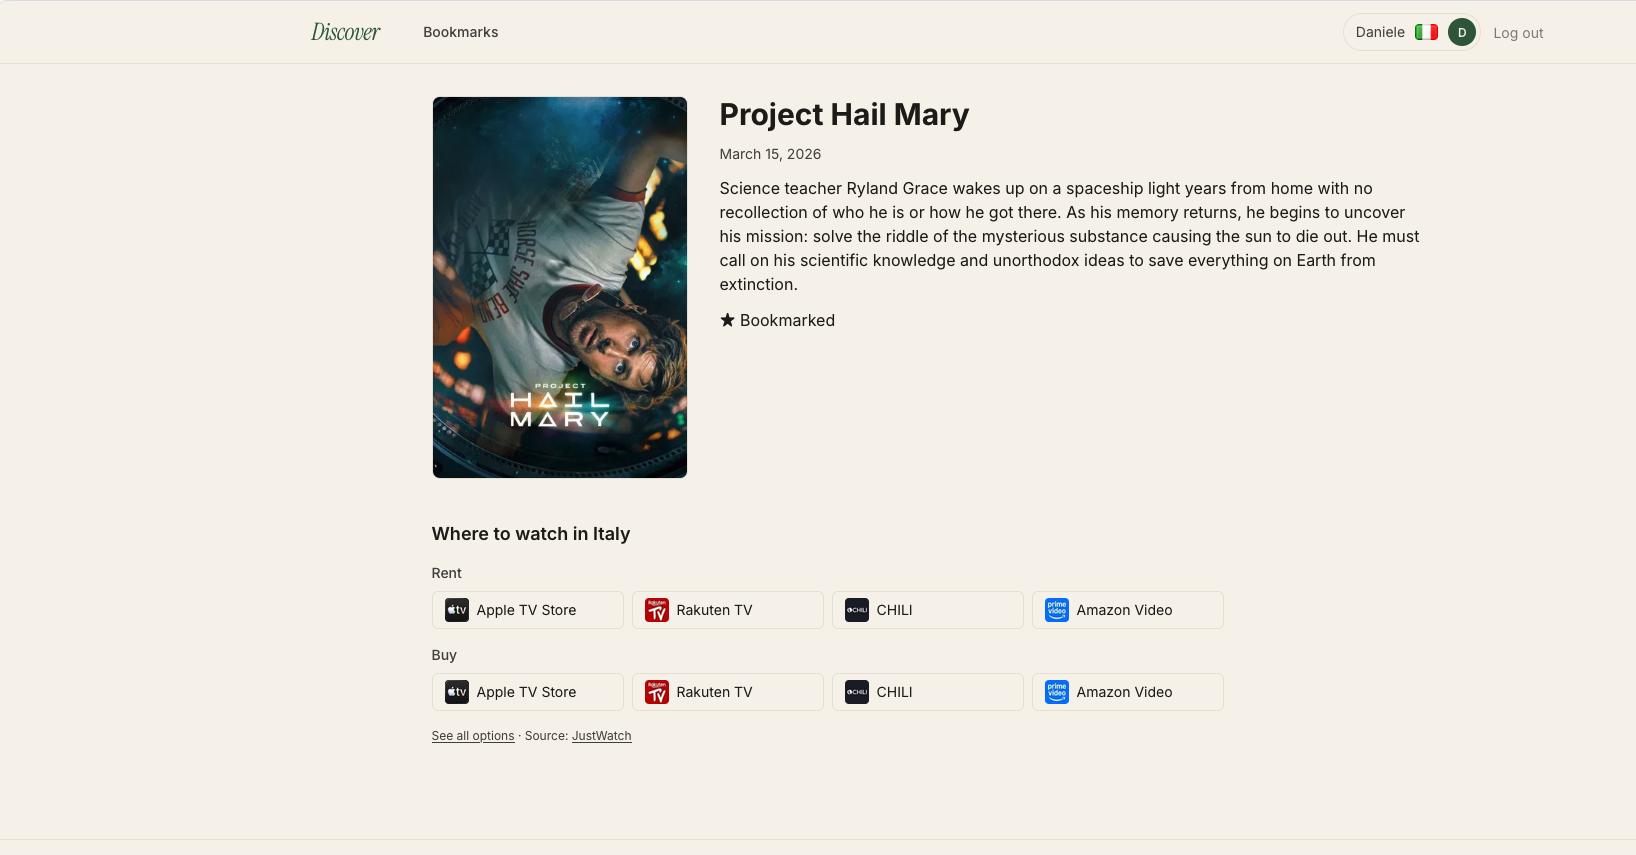
The movie detail page in question. Eight streaming tiles under "Where to watch in Italy." Looks ordinary. Those eight tiles became eight database queries.
What N+1 means
Once someone explains the name, it's literal.
N+1 = one query to get a list of N things, then N more queries (one per item) to fetch something related to each.
The "1" is the initial query. The "N" is the follow-ups. Total: 1+N queries where you almost certainly needed 1.
The reason it's a named problem rather than just "too many queries" is the scaling. With 4 items it's 5 queries, barely noticeable. With 100 it's 101. With 1000 it's 1001. The query count grows with your data size, which makes the problem easy to miss during development on a small database and a lot more noticeable in production.
The visual signature
N+1 looks the same wherever it appears, in any tool, in any framework: a series of nearly-identical queries differing only by an ID. Once your eye is trained on that shape, you start spotting it in slow query logs, APM traces, debug toolbars, anywhere SQL is visible.
At first I assumed the cache-miss path was the real issue. The toolbar made it obvious the cache-hit path wasn't great either.
Here's the cache-hit trace for the page above, exactly as Django Debug Toolbar showed it:
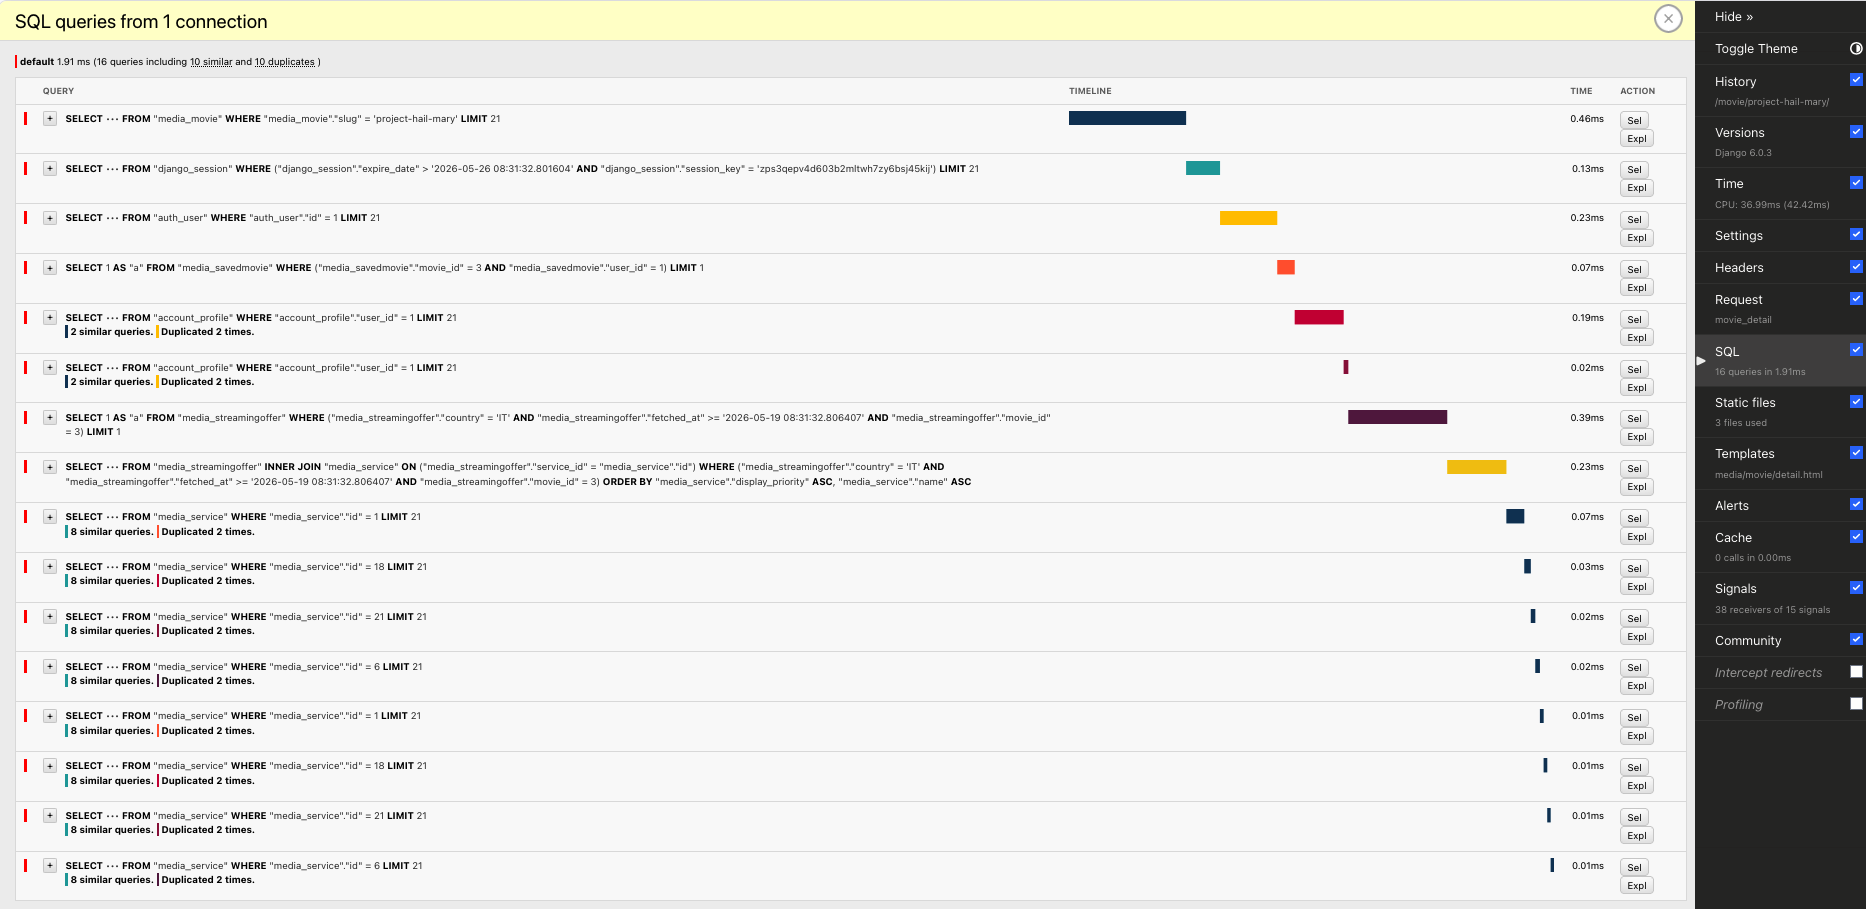
Look at the tail of that trace. The same query, eight times, with only the id value changing:
SELECT ••• FROM "media_service" WHERE "media_service"."id" = 1 LIMIT 21
SELECT ••• FROM "media_service" WHERE "media_service"."id" = 18 LIMIT 21
SELECT ••• FROM "media_service" WHERE "media_service"."id" = 21 LIMIT 21
SELECT ••• FROM "media_service" WHERE "media_service"."id" = 6 LIMIT 21
SELECT ••• FROM "media_service" WHERE "media_service"."id" = 1 LIMIT 21
SELECT ••• FROM "media_service" WHERE "media_service"."id" = 18 LIMIT 21
SELECT ••• FROM "media_service" WHERE "media_service"."id" = 21 LIMIT 21
SELECT ••• FROM "media_service" WHERE "media_service"."id" = 6 LIMIT 21
Eight queries fetching Service rows by their primary key. The toolbar's own annotations flag it: "8 similar queries. Duplicated 2 times." Similar because they all hit the same table with the same shape. Duplicated because four of the IDs repeat: the same row fetched twice. That last detail is worth pausing on: this particular N+1 isn't just redundant in the abstract sense; the loop is fetching the exact same row over and over because the page shows Project Hail Mary on Apple TV under Rent and under Buy. Eight tiles, four distinct services, four rows fetched twice each.
Once you start spotting that pattern, the fixes become much easier to reason about.
Pattern 1: select_related for reading related objects in a loop
The cause: the caller iterating a queryset and reading a foreign key on each row.
The first N+1 wasn't in my function, it was in the caller. My function returned a queryset of StreamingOffer rows. The template iterated:
{% raw %}
{% for offer in offers %}
  <img src="{{ offer.service.logo_url }}" alt="{{ offer.service.name }}">
{% endfor %}
{% endraw %}
That offer.service.name is the trap. Django, by default, is lazy about following foreign keys: it loads the offer, but it doesn't load the related Service until you ask for it. Each access fires a fresh SELECT. With eight offers on the page, the template triggered eight extra queries.
The fix: select_related("service"). It tells Django: "I'm going to use this relation; bring it back as a JOIN in the same query and keep it attached to the returned objects."
return StreamingOffer.objects.filter(
    movie=movie, country=country
).select_related("service")
The function had three return sites (cache hit, fetch failed, cache refreshed). The fix went on all of them: missing one would leave the N+1 alive on that branch.
For the reverse direction or many-to-many relations, the equivalent is prefetch_related. Different mechanism, same goal.
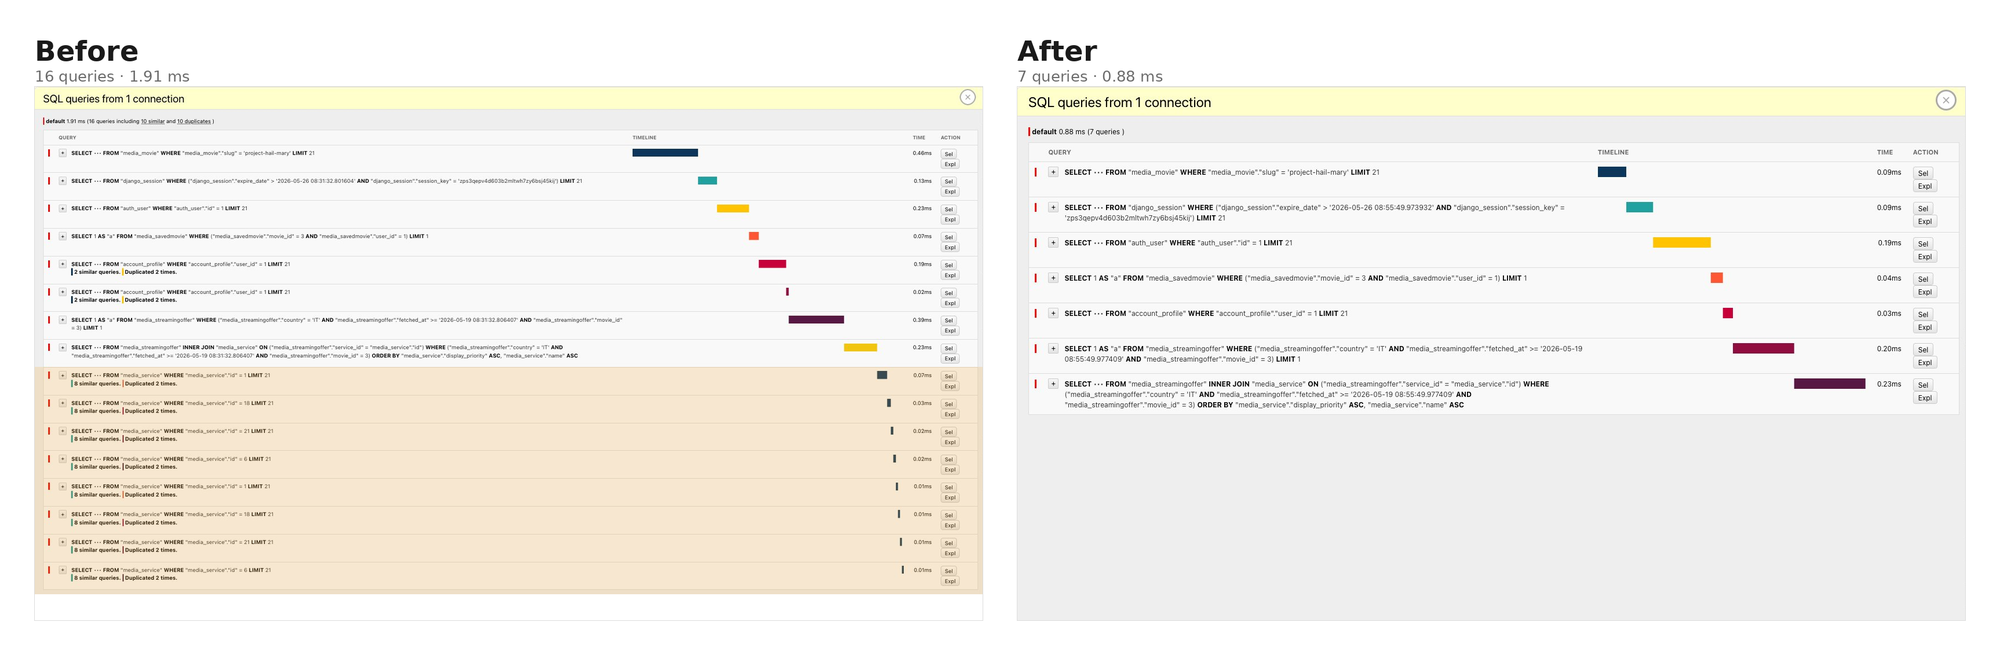
The eight WHERE id = N queries collapsed into the single INNER JOIN that was already in the trace: the JOIN existed for ORDER BY service.display_priority, but Django was only using the joined data for sorting and discarding it. select_related is what keeps the joined columns attached so the template gets them for free.
Bonus: the relationship cache and request.user.profile
While I was at it, I also noticed the account_profile query running twice per request, flagged as "Duplicated 2 times." That one wasn't an N+1 (the count didn't scale with anything), but it was the same kind of fix.
My view did Profile.objects.get(user=request.user). Elsewhere, a template context processor accessed request.user.profile. They return the same row, but the manager call doesn't populate Django's per-request relationship cache; the attribute access does. So the view fetched, the context processor fetched again, and the toolbar flagged the duplicate.
Switching the view to request.user.profile collapsed the two into one. The lesson: how you fetch a related object affects whether the result is cached for the rest of the request.
Result: 16 → 7 queries on every page load.
Pattern 2: gather + __in + dict for lookups in a loop
The cause: calling .get() or .filter() on a model inside a loop, once per iteration.
The second N+1 lived inside my function, on the cache-miss path. To rebuild the cache I needed to match each provider TMDB returned to a Service row in my database. The original code did this with .get() inside the inner loop:
for offer_type_key in StreamingOffer.OfferType.values:
    for provider in country_data.get(offer_type_key, []):
        try:
            service = Service.objects.get(tmdb_provider_id=provider["provider_id"])
        except Service.DoesNotExist:
            ...
            continue
        StreamingOffer.objects.create(movie=movie, service=service, ...)
Same shape as Pattern 1 (a query per loop iteration), but this time I was writing the queries explicitly, not the ORM doing it lazily.
select_related doesn't apply here: I'm not starting from a queryset with a FK to follow, I'm starting from a list of dicts that came from a JSON response. The match key (tmdb_provider_id) is just a column value, not a relationship Django knows about.
The fix: gather every value I'll need before the loop, fetch them all in one query with __in, build a dict to look them up locally.
provider_ids = {
    p["provider_id"]
    for ot in StreamingOffer.OfferType.values
    for p in country_data.get(ot, [])
}

services_by_id = {
    s.tmdb_provider_id: s
    for s in Service.objects.filter(tmdb_provider_id__in=provider_ids)
}
Then the loop body becomes a dict lookup:
service = services_by_id.get(provider["provider_id"])
if service is None:
    ...
    continue
The __in field lookup is Django's syntax for SQL's IN (...). The double underscore separates the field name from the lookup operator, so tmdb_provider_id__in=provider_ids compiles to WHERE tmdb_provider_id IN (10, 40, 2, 35). One round trip, all the rows.
The try/except DoesNotExist becomes if service is None, because dict.get() returns None for missing keys instead of raising. Same logic, different shape.
One nice property: if provider_ids ends up empty (no providers for this country), Django skips the query entirely. filter(tmdb_provider_id__in=set()) returns an empty queryset with no SQL. The pattern degrades gracefully.
Result: N service lookups → 1.
Pattern 3: bulk_create for writes in a loop
The cause: calling Model.objects.create(...) inside a loop, once per row.
Even after Pattern 2 was applied, the loop was still issuing one INSERT per provider:
StreamingOffer.objects.create(
    movie=movie, service=service, country=country, offer_type=offer_type_key,
)
Eight providers, eight separate INSERT statements. Same scaling problem, write side.
Worth calling out because Django's API makes this easy to overlook: .create() builds the instance and immediately issues the INSERT. Inside a loop, every iteration becomes its own database round trip.
The fix: bulk_create. Build the objects in memory first, hand the whole list to Django, get one multi-row insert.
offers_to_create = []
for offer_type_key in StreamingOffer.OfferType.values:
    for provider in country_data.get(offer_type_key, []):
        service = services_by_id.get(provider["provider_id"])
        if service is None:
            ...
            continue
        offers_to_create.append(StreamingOffer(
            movie=movie, service=service, country=country, offer_type=offer_type_key,
        ))

StreamingOffer.objects.filter(movie=movie, country=country).delete()
StreamingOffer.objects.bulk_create(offers_to_create)
StreamingOffer(...) is just the constructor, no database call. bulk_create is what writes. The resulting SQL is one statement with multiple VALUES rows:
INSERT INTO media_streamingoffer (...) VALUES
  (3, 18, 'IT', 'rent', ...),
  (3, 1,  'IT', 'rent', ...),
  (3, 6,  'IT', 'rent', ...),
  (3, 21, 'IT', 'rent', ...),
  ...
Multi-row insert is standard SQL. The database parses once, locks once, commits once.
Worth knowing: bulk_create skips save() and the pre_save/post_save signals. For a cache table with no custom save logic that's fine. But if your model has either, think about whether the bypass is acceptable. auto_now and auto_now_add fields are handled correctly in modern Django (4.x+).
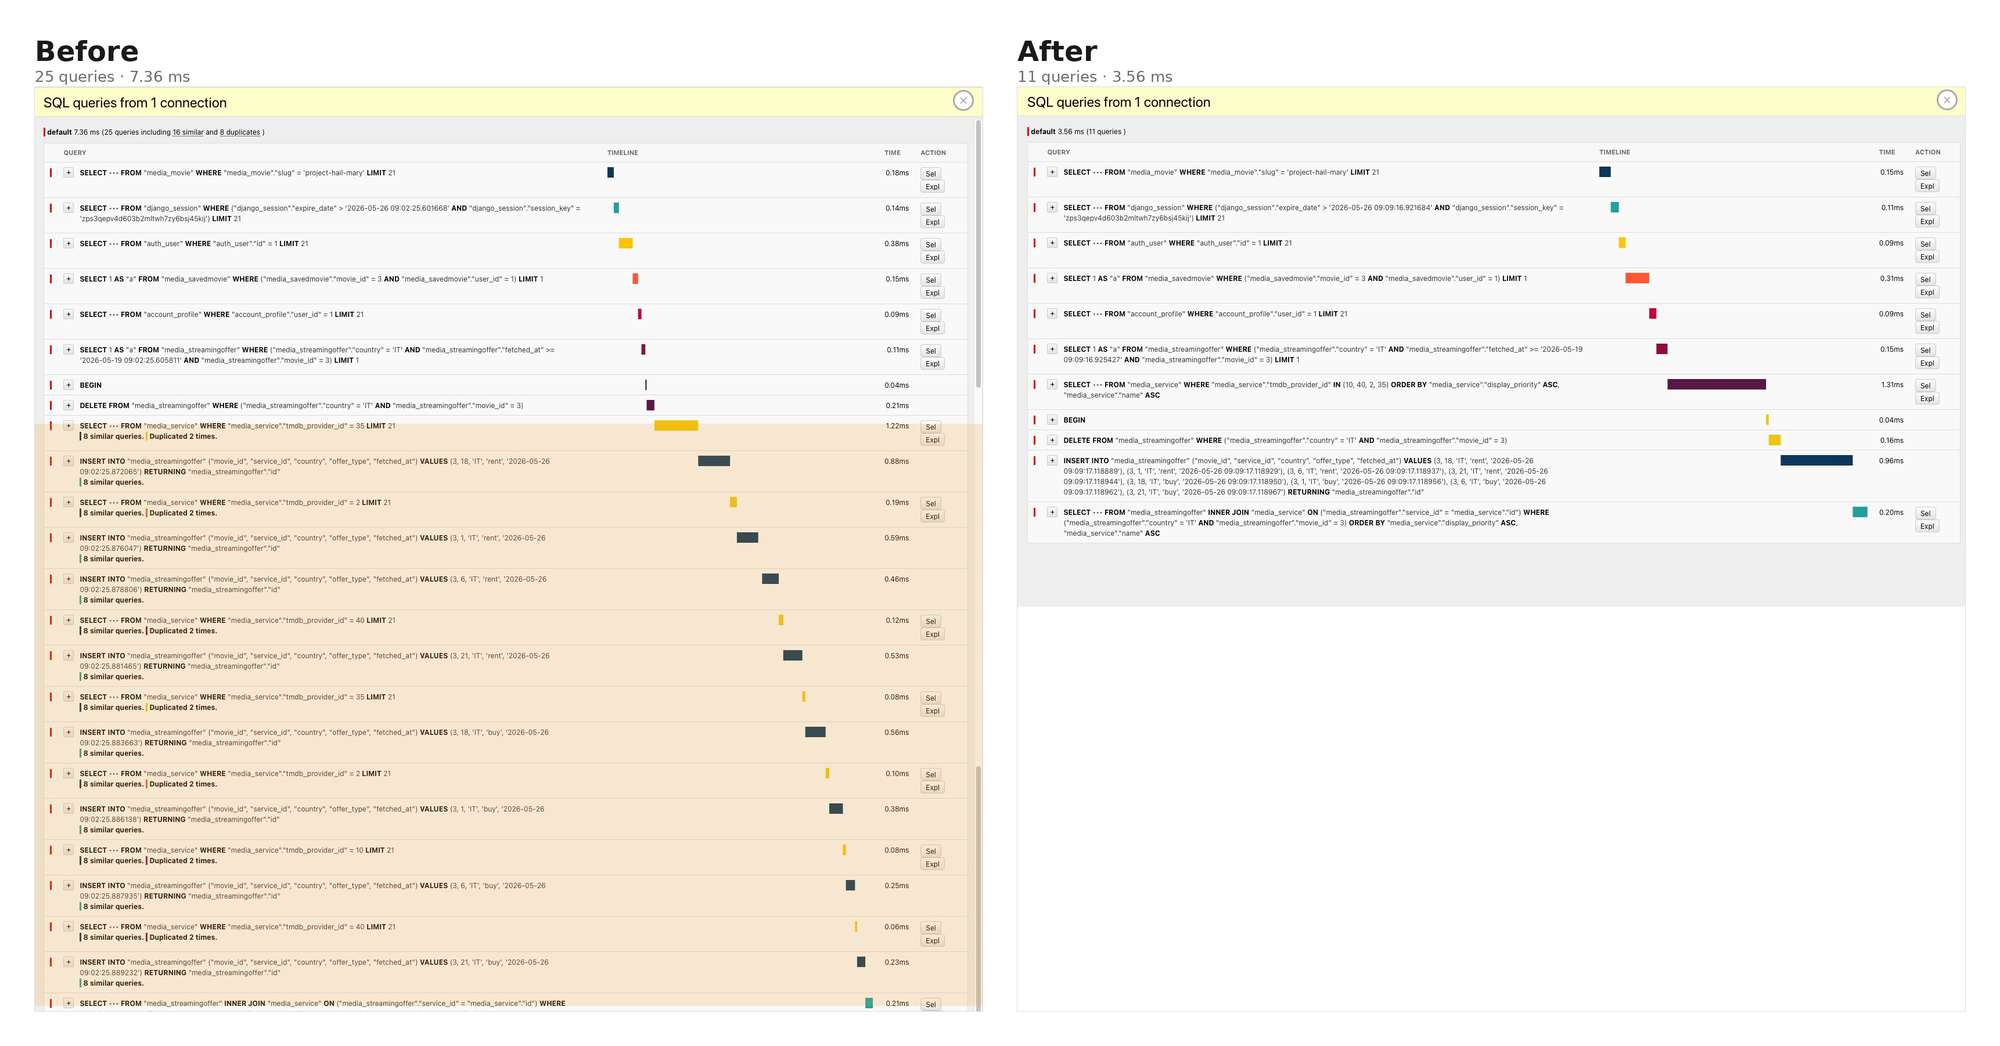
Both Pattern 2 and Pattern 3 are visible in the same after-screenshot. The eight interleaved WHERE tmdb_provider_id = N lookups collapsed into one IN query. The eight individual INSERT statements collapsed into a single multi-row INSERT.
Result: 25 → 11 queries on cache refresh.
The scoreboard
| Path | Before | After | Saved |
|---|---|---|---|
| Cache hit (every page load) | 16 queries | 7 queries | 9 |
| Cache miss (when data is stale) | 25 queries | 11 queries | 14 |
Both savings scale with N. The numbers above are for one movie with four streaming services across two offer types. A movie with thirty offers would have made the unoptimized cache miss roughly 65 queries; the fixed version is still 11.
The pattern under the patterns
All three problems came down to the same thing: the number of database round trips scaling with input size.
- Reading related objects on iterate? Forward FK or OneToOne →
select_related. Reverse or many-to-many →prefetch_related. - Looking something up by a non-FK column in a loop? Gather,
__in, dict. - Writing rows in a loop?
bulk_create.
Django ends up having a different optimization for each of these cases. After a while, you start recognizing these shapes almost immediately in query traces. The harder skill is noticing them at all: that's not a code-reading skill, it's a tooling habit.
What to do next
If you're working on a Django project and don't have Django Debug Toolbar wired up in development, that's one of the most useful development tools you can add. Without it, my page felt fine and I would have shipped 14 unnecessary queries on every cache refresh without noticing. With it, every problem was visible in the SQL panel before I even understood what I was looking at. The "similar queries" and "duplicated" annotations pointed me at the exact lines that needed fixing.
Install it and open the SQL panel on an older page in your project. You'll probably find at least one N+1 quickly. The patterns above will tell you how to fix it.
Thanks to Bob Belderbos for the original code review comment that started this rabbit hole.